What is the Timeline (Gantt Chart)?
The Timeline (Gantt Chart) is a visual view of your project plan. It shows all of your tasks and milestones laid out along a calendar, so you can see exactly when work is scheduled, how tasks relate to each other, and how progress is tracking.

Once you've created tasks in your plan and set start and due dates, you can open the Timeline View to view your entire project schedule at a glance.
Prepare Your Plan
Before using the Timeline View, make sure your plan is set up correctly:
- The tasks on your plan must have start and due dates. Tasks without dates will not display correctly in the Timeline View.
- The project (or plan) start date determines the Project Start point on the timeline
- The due date of your final task determines the Project End point on the timeline

It's best to create and date your tasks first in the Plan, List or Grid view, then switch to the Timeline to visualize and adjust them.
Important: Always set your project start date earlier than your first task. If a task is scheduled before the project start date, the Timeline will shift it to appear at the project start date (even though the task itself isn’t stored that way). You can adjust this using the Change Start Date button, and optionally let Copilot auto-reschedule tasks for you.
Open and Explore the Timeline View
To access the Timeline View for a project:
Open your project and click on Open Plan.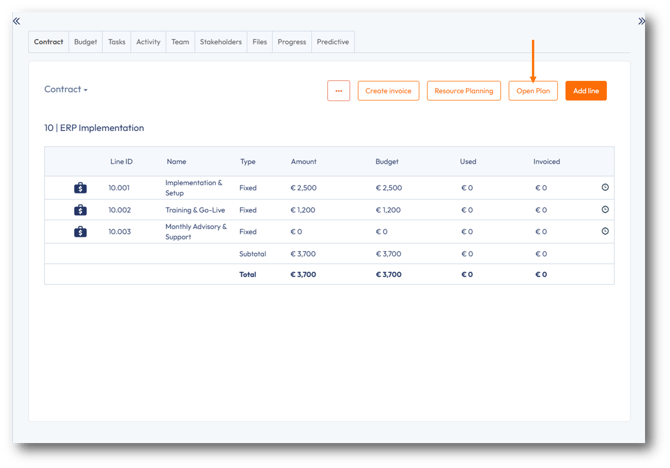
The plan for your project appears. On the left-hand side menu, select Timeline.
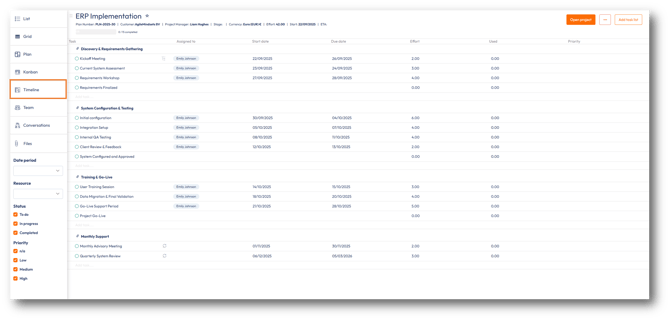
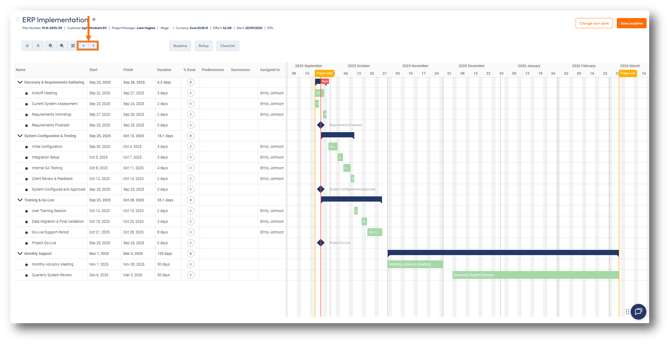
Your project will now be displayed as a Timeline.

To expand or collapse all task lists for a clearer overview of the Timeline, use the Expand All or Collapse All buttons:
Adjust your view by zooming in, zooming out, or using the Zoom to Fit button to display the entire project span:
Monitor and Review Progress
The Timeline includes tools to help you track how your project is performing against the plan.
Baseline
A baseline is like a snapshot of your plan at a specific point in time. It allows you to compare the original schedule against what is actually happening.

To set a baseline, click Save Baseline in the toolbar of the Timeline.
If tasks are delayed or rescheduled, the baseline remains visible for comparison.
Saving a new baseline will overwrite the previous one.
Roll-Up
The roll-up feature summarizes tasks at the tasklist level:
- A green bar shows the overall schedule of all tasks in that tasklist
- Darker green areas indicate overlapping tasks
- Gaps show periods where no tasks are scheduled.

To enable the roll-up feature, simply click on the Roll-up button in the toolbar of the Timeline.
Manage Your Plan Visually
Once your Timeline is set up, you can manage your entire project plan directly by interacting with tasks on the Timeline.
Adjust Tasks
To adjust the schedule of a task, simply drag and drop the task bar along the timeline.
You can also extend or shorten the bar to change the duration. This immediately updates the start and due dates of that task.
Create and edit dependencies
In the Timeline View, you can link tasks using the following dependences:- Finish to Start (Task B starts only after Task A is completed)
- Start to Start (Task B can start once Task A begins)
- Finish to Finish (both tasks must finish at the same time)
To create a dependency, drag from one of the circles at the end of a task bar to another task bar.

Alternatively, you can set up dependencies using the Predecessor and Successor columns:

In the example below, both the Initial Configuration and the Current System Assessment tasks are dependent on the Kickoff Meeting task:

To edit the dependency details of a task, double-click the dependency line and the following dialog box appears:

Adjust view and change column order
By dragging and dropping the slide bar, you can adjust view of the columns.

To re-order the data columns in the table, you can drag and drop your desired column to its preferred position. In the example below, the Assigned To column is being repositioned:

Add new tasks to the Timeline
To create a new task right-click an existing task and select Add, Add task above or Add task below.

The new task will appear as New task 1. Right-click the task and select Edit.

Complete the task information as you would in the Plan, List or Grid:

Update task progress
An assigned team member can update the progress of their task by selecting the task and sliding the progress bar to the desired percentage:

The %DONE column is automatically updated

Searching for a task
In the case of large projects where there are a high volume of tasks, it can be cumbersome to locate individual tasks in the timeline.
The Name field supports a filter function, so you can search for specific tasks:
Large projects containing high volume of tasks can be tiresome to locate in the Timeline.
The FIND TASKS BY NAME search box can help you limit the your tasks in view:

The results immediately appear:

Additional functionalities
The Gantt toolbar also has the following functionalities:
|
Functionality |
Description |
 |
Expand all tasklists and tasks |
 |
Collapse all tasklists and tasks |
 |
Zoom in/out of timeline |
 |
Fit all tasklists, tasks, checklist items and milestones to the Timeline |
 |
Move back/forward to next time span |