Track multiple projects with the Overall Timeline (Gantt Chart)
Understand how to simultaneously track the progress of multiple projects
The Overall Timeline (Gantt Chart) in PSOhub gives you a consolidated, big-picture view of your projects. It shows how multiple projects align, overlap, and progress relative to each other, bringing several project plans into a single, visual schedule. This makes it easier to track milestones, dependencies, and delivery dates across your portfolio.

Access the Overall Timeline
From the main menu, go to Plans > Timeline.
The Overall Timeline will first open as a blank view with no projects populated.
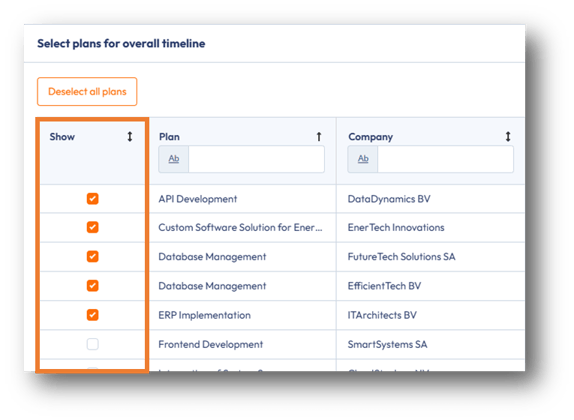
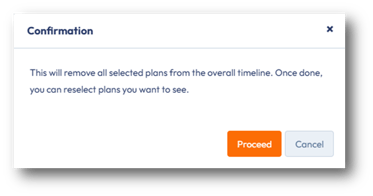
To select the projects you want to display on the Timeline, click Select Plans.

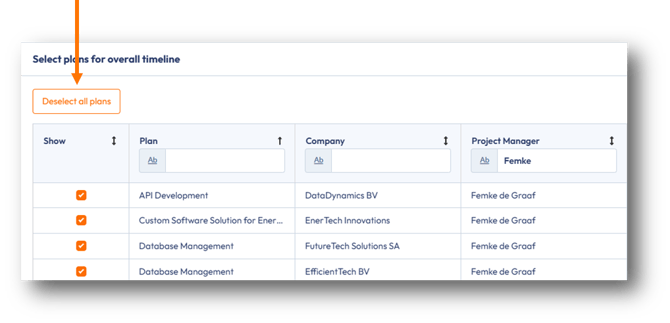
In the dialog window that appears, search or filter to find the projects you want to include. You can filter by Plan, Company, Project Manager, Dates, and Task Count.

Use the eye icon to customize which columns are visible.

Explore the Overall Timeline
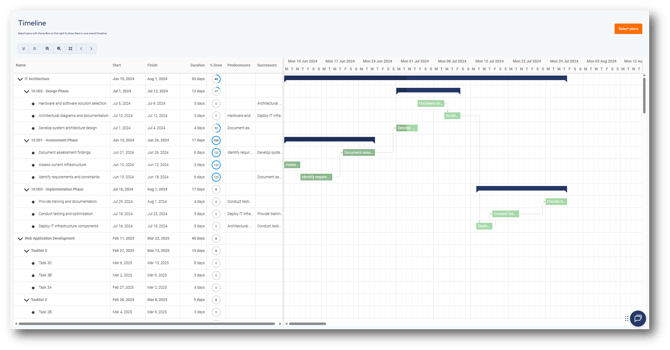
The Overall Timeline is split into two panels: a grid on the left and a Gantt chart on the right. Together, these give you both a structured breakdown of your projects and a visual schedule.
The Grid

The grid displays a clear hierarchy of your projects: Plans → Tasklists → Tasks. You can expand or collapse levels of the hierarchy to view as much or as little detail as you need.

The grid is made up of the following fields:
| Column | Description |
| Name | Displays the name of each plan, tasklist, task, or milestone. |
| Start | The scheduled start date of a task, tasklist, or plan. |
| Finish | The scheduled due date of a task, tasklist or plan. |
| Duration | The total time (in days) between the start and finish dates. |
| % Done | Shows progress on tasks or tasklists as a percentage. |
| Predecessors | Tasks that must be completed before the current task can begin. |
| Successors | Tasks that depend on the current task being completed. |
The Timeline
In the Timeline:
- Dark blue bars represent project Plans and Tasklists.
- Green bars represent individual Tasks.
- Diamond icons mark Milestones, with milestone names visible in both the grid and the chart.
- Arrowed connectors show Dependencies between tasks. These are read-only in the Overall Timeline — they must be set at the project level.
- The vertical red “Now” line marks today’s date, helping you track progress relative to the current day.

The Toolbar
| Icon | Function | Description |
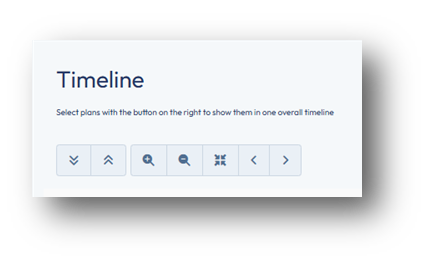
| Collapse all / Expand all | Collapse or expand all project plans in the grid. | |
| Zoom in / Zoom out | Zoom in or zoom out on the timeline. | |
| Zoom to fit | Automatically resize the chart to fit all tasks in view. | |
| Previous / Next | Scroll the chart forwards or backwards in time. |

